


, using xCT Antibody at 1/1000 dilution.
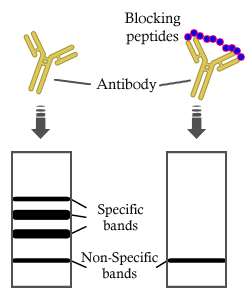
5ug/NC membrane strip.
Exposure for 5s with Affinity™ ECL Kit(#KF8003).
Bands result from membrane strip incubation.")


 and mouse anti-beta tubulin Ab(T0023 1:200) for 1 hour at 37°C. An AlexaFluor594 conjugated goat anti-rabbit IgG(H+L) Ab(Red) and an AlexaFluor488 conjugated goat anti-mouse IgG(H+L) Ab(Green) were used as the secondary antibody.
The nuclear counter stain is DAPI(blue).")
 GPX4 and (B) xCT. The random grouping situation was WT group, APP/PS1 model group,
TSG (60, 120 and 180 mg/kg) groups. Scare bar: 500, 100 and 50 μ m, n = 5/group.")
 The
protein expression levels of GPX4,
GPX1, FTH1, xCT, CD98, DMT1,
ACSL4, NCOA4, Ferritin Light Chain
and Ferritin Heavy Chain were
assessed. The levels were normalized to
β-actin. (B) GPX4, GFAP and DAPI
fluorescence staining co-localization of
WT, APP/PS1 and TSG 60 mg/kg
group. (C) GPX4, Iba1 and DAPI fluo-
rescence staining co-localization of WT,
APP/PS1 and TSG 60 mg/kg group. P #
< 0.05, P ## < 0.01, P ### < 0.001 vs
WT group. P* < 0.05, P ** < 0.01, P ***
< 0.001 vs APP/PS1 group. 2×, 100 ×
magnification, scare bar: 500 and 100
μ m, n = 5/group.")
 induces ROS production via SLC7A11 suppression and GSH reduction in MM cells. (A and B) GSH levels were measured using GSH and GSSG Assay Kit after chidamide treatment for 24 hours in ARP-1 and RPMI-8226 cells. (C and D) changes of SLC7A11 mRNA levels with different doses of chidamide treatment for 24 hours in ARP-1 and RPMI-8226 cells. (E-H) changes of SLC7A11/xCT protein levels with different doses of chidamide treatment for 24 hours in ARP-1 and RPMI-8226 cells using Western blotting and immunofluorescence analysis. Scale bars represent 20 μm. *, p < 0.05; **, p < 0.01; ***, p < 0.001 vs control.")
 Western blot for GPx4, SLC7A11, Nrf2, HO-1, p-Pi3K, and p-Akt in the rat kidney.")
 Renal cortex expression of SLC7A11, GPX4, HO-1 and SOD2 determined by immunofluorescence staining in mice after glyoxylic acid treatment (magnification, ×400). (B-E) Quantification of (B) SLC7A11, (C) GPX4, (D) HO-1 and (E) SOD2 in mouse kidneys assessed using immunofluorescence. (F) Western blot analysis of SLC7A11, GPX4, HO-1 and SOD2 in renal tissue lysates from these groups. (G-J) The ratio of the optical density of (G) SLC7A11, (H) GPX4, (I) HO-1, and (J) SOD2 to GAPDH was statistically analyzed. (K) Representative images of mitochondrial injury under glyoxylic acid treatment were observed by TEM. White triangles represent the injured mitochondria. The data are presented as the mean ± SD; n=6. *P<0.05 vs. the control group. CaOx, calcium oxalate; SLC7A11, solute carrier family 7 member 11; GPX4, glutathione peroxidase 4; HO-1, heme oxygenase 1; SOD2, superoxide dismutase 2; TEM, transmission electron microscopy.")
 Renal cortex expression of SLC7A11, GPX4, HO-1 and SOD2 determined by immunofluorescence staining in mice after glyoxylic acid treatment (magnification, ×400). (B-E) Quantification of (B) SLC7A11, (C) GPX4, (D) HO-1 and (E) SOD2 in mouse kidneys assessed using immunofluorescence. (F) Western blot analysis of SLC7A11, GPX4, HO-1 and SOD2 in renal tissue lysates from these groups. (G-J) The ratio of the optical density of (G) SLC7A11, (H) GPX4, (I) HO-1, and (J) SOD2 to GAPDH was statistically analyzed. (K) Representative images of mitochondrial injury under glyoxylic acid treatment were observed by TEM. White triangles represent the injured mitochondria. The data are presented as the mean ± SD; n=6. *P<0.05 vs. the control group. CaOx, calcium oxalate; SLC7A11, solute carrier family 7 member 11; GPX4, glutathione peroxidase 4; HO-1, heme oxygenase 1; SOD2, superoxide dismutase 2; TEM, transmission electron microscopy.")
. The western blot results of MAD2L2 and mTOR signaling relative proteins. (B. C. D). The predictive correlation of mTOR and ferroptosis relative genes. (E). The western blot results of mTOR and ferroptosis relative proteins.")
 (A). The WB results of SLC7A11 and TFR-1 among groups (n = 3) (B - C). Immunohistochemistry and quantitative analysis of SLC7A11 and TFR-1 in NC, DN, and TUDCA group (n = 3) (D - E). The content of iron (F), MDA (G), and GSH (H) in renal tissues (n = 6). Data are expressed as the mean ± SEM.")
 (A). The WB results of SLC7A11 and TFR-1 among groups (n = 3) (B - C). Immunohistochemistry and quantitative analysis of SLC7A11 and TFR-1 in NC, DN, and TUDCA group (n = 3) (D - E). The content of iron (F), MDA (G), and GSH (H) in renal tissues (n = 6). Data are expressed as the mean ± SEM.")
 Representative images of original western blotting analysis of GPX4 (A) and SLC7A11 (B) protein expression. (C,D) Summarized data of GPX4 (C) and SLC7A11 (D) protein abundance relative to GAPDH. The values are presented as means ± SD. n = 4 in each group. * p < .05, ** p < .01, when compared to the Ctr group; # p < .05, ### p < .001, when compared to the PA group. (E–I) The mRNA expression levels of GPX4 (E), SLC7A11 (F), PTGS2 (G), ACSL4 (H), and NOX1 (I) after drug treatment. The values are presented as means ± SD. n = 4 in each group. * p < .05, ** p < .01, *** p < .001, when compared to the Ctr group;")
 CCK-8 assay was used to determine the dose of CVB-D and LPS for further study. (B) Effect of CVB-D on LPS-treated H9C2 cell viability. (C) Effect of CVB-D on CK-MB levels, LDH activity and cTnI levels of LPS-treated H9C2 cells. (D) Effect of MDA generation, GSH levels and SOD activity in LPS-treated H9C2 cells. (E) Effect of CVB-D on the expression of ptgs2 mRNA levels (n=3). (F) Representative fluorescent microscopy images of ROS production by H9C2 cells (n=3). (G) SLC7A11 and GPX4 protein expression levels of LPS- and CVB-D-treated H9C2 cells. Western blot images were taken from different gels but a single replicate. *P")
 of ferroptosis between the KLF11-NC, KLF11-OE and KLF11-KO of A549 and PC9 cell lines. f, g Western blot results showed differences in protein levels of GPX4, SLC7A11, and ASCL4 of ferroptosis between the KLF11-NC, KLF11-OE, and KLF11-KO of A549 and PC9 cell lines.")
 Western blot assay used to detect the protein expression levels of CX43, aggrecan, Col2, Sox9, MMP13, BCL-2, and cleaved caspase-3 in OA and normal cartilage samples. (b) The expression levels of CX43 and antiferroptosis proteins (GPX4, SLC7A11) in chondrocytes transfected with or without Agomir-1 and CX43. (c) C11 BODIPY fluorescent probe used to detect the level of intracellular lipid-ROS in chondrocytes. Red indicated unoxidized dye, green indicated oxidized dye. (d) Intracellular ROS in chondrocytes detected by DCFHDA. (e–f) Fe2+ and MDA concentrations in chondrocytes were measured using the iron assay kit and MDA assay kit. Scale bar = 200 µm. Data were presented as the mean ± SD of at least three replicates.")

 The cell viability 24 h after LPS (0, 0.5, 1, 2, 4, and 8 μg/mL) treatment was assayed by CCK-8; *P")
 Immunohistochemical of Nrf2, P53, SLC7A11, and GPX4 in knee joint, the staining results were calculated by the percentage of positive staining cells (b), ×100, Scale bar, 100 μm. (c) Results of Western blot analysis of articular cartilage in each group, and the relative protein expression level was calculated in (d). **P")
 Immunohistochemical of Nrf2, P53, SLC7A11, and GPX4 in knee joint, the staining results were calculated by the percentage of positive staining cells (b), ×100, Scale bar, 100 μm. (c) Results of Western blot analysis of articular cartilage in each group, and the relative protein expression level was calculated in (d). **P")
 Heatmap displays the PBS and I/R cohorts' distinctive abundance characteristics. (B) The KEGG database's functional classification of the FGF2-regulated genes. (C) WB assay of GPX4, 4-HNE, and SLC7A11 in skeletal muscle tissues. (D) Quantification of protein level of SLC7A11, 4-HNE and GPX4 from (C) with normalised to GAPDH band density. (E) WB assay of GPX4, 4-HNE, and SLC7A11 in skeletal muscle samples. (F) Skeletal muscle slices with GPX4 and CD31, an EC marker, stained. DAPI staining is used to identify the nuclei. Scale bars: 100 μm. (G) Quantification of protein level of SLC7A11, 4-HNE and GPX4 from (E) with normalized with respect to GAPDH band density. (H) Quantification of GPX4 and CD31 double-positive cells, the percentages of double positive cells versus total CD31 positive cells are indicated. (I) Content of Fe2+ was plotted as a histogram. (J) A histogram displaying the MDA content. (K) Content of GSH was plotted as a histogram. (L) Sections of skeletal muscle stained with 4-HNE, with DAPI staining identifying the nuclei. Scale bars: 100 μm. Based on the immunofluorescence results in (L), the average 4-HNE optical density is shown in (M). Data are presented as mean ± SD (n = 3-5 per group). Significance: *P < 0.05.")

 cells. (a, b) Bavachin induces GSH depletion in a dose-related manner over 24 h. (c, d) Bavachin greatly induces ROS generation in OS cells over 24 h. (e, f) Bavachin increases MDA accumulation in a dose-related manner. (g, h) Western blotting analysis shows the expression of p-STAT3, STAT3, P53, SLC7A11, and GPX4 in OS cells treated with bavachin (10 μM, 20 μM, and 40 μM) for 24 h. &p < 0.01 vs. the control group, #p < 0.001 vs. the control group, ∗p < 0.05, ∗∗p < 0.01, and ∗∗∗p < 0.001.")
 combined with doxorubicin (DOX) regulated the intracellular iron level and of ferroptosis-related proteins. A and B, Cellular iron levels were measured using the iron ion detection kit after treatment for 48 h. C-F, Western blot detection and quantification analysis of the SLC7A11 and GPX4 protein in 8505C (C and D) and CAL62 cells (E and F) after treatment for 48 h. Data are reported as mean and SD. **P")
 Transmission electron microscopy images of mitochondrial morphology in the hippocampus (scale bar=2 μm). (B) Western blot analysis of xCT and GPX4 in the hippocampus. (C-D) Relative density analysis of xCT and GPX4 protein bands in the hippocampus. (E) Western blot analysis of xCT and GPX4 in HT22 cells. (F-G) Relative density analysis of xCT and GPX4 protein bands in HT22 cells. Data are presented as mean ± SD (n=3). * significant difference compared to the control group (*P")
 After the drug treatment, LN229 and U251 cells showed decreased expression of xCT, FHL and GPX 4, Accumulation of TFRC, DMT 1 and p53 (Flubendazole, 0, 0.125, 0.25, 0.5 μM, 24 h); (C, D) GPX4 depletion in U251 and LN229 cells treated with drugs (Flubendazole, 0.5 μM, 24 h; 400X, 1: 50 μm). (E–G) Flubendazole binds to two sites 229 Gly and 314 Arg in xCT protein. (2D diagram); (F, H) Flubendazole binds to two sites 457 Thr and 516 Gly in TFRC protein. (Student's t‐test was used.).")
 Various concentrations of PS-NPs (50 µg/mL, 100 µg/mL, 200 µg/mL) in different treatment times (6–24 h) reduce cell viability in GC-2 cells. (B and C) Representative images and quantification of fluorescence intensity for lipid peroxidation levels labelled with C11 BODIPY in GC-2 cells post-exposed with PS-NPs. Statistical analysis presented the ratio of MFI of green to red. (D-F) The levels of MDA, GSH, and total Fe were detected in GC-2 cells after PS-NPs treatment for 12 h. (G and H) Representative images and quantification of fluorescence intensity showing intracellular chelatable iron in GC-2 cells post-exposure to PS-NPs labelled with FerroOrange (red). (I and J) DCFH-DA staining was performed to detect ROS levels of GC-2 cells after PS-NPs exposure for 12 h using fluorescent microscopy. (K) Flow cytometry analysis of and ROS levels of GC-2 cells after PS-NPs exposure for 12 h using Fluorescence-activated cell sorting (FACS). (L) qRT-PCR analysis of ferroptosis-related gene expression in GC-2 cells treated with or without PS-NPs. (M and N) Ferroptosis-related proteins in GC-2 cells stimulated by PS-NPs were determined by western blotting. And semi-quantification of protein expression levels normalized to β-actin. (O) Representative TEM images depicting mitochondria in GC-2 cells in response to exposure to PS-NPs. The reduction of mitochondrial cristae is denoted by yellow arrows, while red arrows signify mitochondrial membrane rupture. (P and Q) Representative illustration and quantification of fluorescence intensity depicting mitochondria in GC-2 cells after treatment with PS-NPs using Mito-Tracker Green. (R and S) Illustration and quantification data of mitochondrial membrane potential in GC-2 cells in response to treatment of PS-NPs stained with TMRE")
 Various concentrations of PS-NPs (50 µg/mL, 100 µg/mL, 200 µg/mL) in different treatment times (6–24 h) reduce cell viability in GC-2 cells. (B and C) Representative images and quantification of fluorescence intensity for lipid peroxidation levels labelled with C11 BODIPY in GC-2 cells post-exposed with PS-NPs. Statistical analysis presented the ratio of MFI of green to red. (D-F) The levels of MDA, GSH, and total Fe were detected in GC-2 cells after PS-NPs treatment for 12 h. (G and H) Representative images and quantification of fluorescence intensity showing intracellular chelatable iron in GC-2 cells post-exposure to PS-NPs labelled with FerroOrange (red). (I and J) DCFH-DA staining was performed to detect ROS levels of GC-2 cells after PS-NPs exposure for 12 h using fluorescent microscopy. (K) Flow cytometry analysis of and ROS levels of GC-2 cells after PS-NPs exposure for 12 h using Fluorescence-activated cell sorting (FACS). (L) qRT-PCR analysis of ferroptosis-related gene expression in GC-2 cells treated with or without PS-NPs. (M and N) Ferroptosis-related proteins in GC-2 cells stimulated by PS-NPs were determined by western blotting. And semi-quantification of protein expression levels normalized to β-actin. (O) Representative TEM images depicting mitochondria in GC-2 cells in response to exposure to PS-NPs. The reduction of mitochondrial cristae is denoted by yellow arrows, while red arrows signify mitochondrial membrane rupture. (P and Q) Representative illustration and quantification of fluorescence intensity depicting mitochondria in GC-2 cells after treatment with PS-NPs using Mito-Tracker Green. (R and S) Illustration and quantification data of mitochondrial membrane potential in GC-2 cells in response to treatment of PS-NPs stained with TMRE")
 rats. (A) Rotameter test. (B) Rotarod test. (C)–(E) Open field test. (F), (G) Immunohistochemistry results showed tyrosine hydroxylase (TH) positive dopaminergic neurons. (H), (I) Western blotting and quantification of TH, hypoxia-inducible factor 1α (HIF1α), solute carrier family 7 member 11 (SLC7A11), nuclear factor-erythroid 2-related factor 2 (Nrf2), and glutathione peroxidase 4 (GPX4) levels. (J) Fe2+ detection. (K), (L) Ferroptosis detection by transmission electron microscope (TEM). Red arrow indicated abnormal mitochondria with higher membrane density and smaller volume. n = 12 for behavior tests, n = 6 for western blotting experiment and TEM, n = 5 for Fe2+ detection. Scale bar = 2 μm in (K) and (L), Scale bar = 200 μm in (F) and (G). ∗p < 0.05, ∗∗p < 0.01, ∗∗∗p < 0.001.")
 Western blot analysis on ferroptosis pathway-related protein changes in HCC38 and HCC1937 cells. Graphs are representatives of three independent experiments. The densitometric analysis of SLC7A11 (C,H), GPX4 (D,I), Keap1 (E,J), Nrf2 (G,K) and HO-1 (F,L) in HCC38 cells. For comparing control and CHRNA9 overexpression groups, 25 μM erastin pre-treatment was applied to induce ferroptosis conditions in HCC38 cells. * p < 0.05; ** p < 0.01; *** p < 0.001. (original western blot images see Supplementary Materials)")
 Analysis were made by Western blot in 9 months-old WT and MPSIIIB mice. Top images are representative blots; bottom left, are quantifications of Keap1 (A), NRF2 (B), Xc- (C) and GPX4 (D) relative to total proteins; bottom right, quantification of total proteins alone. Data are quoted as the mean ± SEM. Loading blot is in Supplementary Data. n ranges 3 to 8 mice.")
 Brain sections were subjected to Prussian blue staining to detect the deposition of iron in the perihematoma of brain tissues, Bar = 200 μm. (D–H) The content of Fe2+, 4-HNE, MDA, GSH, and T-SOD in the striatum tissue of rats were detected. (I) Representative western blot images of P53, GPX4, NRF2, SLC7A11, HIF1α, and HMOX1 at day 3 and day 7. P53 belt was cropped between 50 and 70 kDa. GPX4 belt was cropped between 17 and 25 kDa. NRF2 belt was cropped between 150 and 250 kDa. SLC7A11 belt was cropped between 40 and 50 kDa. HIF1α belt was cropped between 150 and 250 kDa. HMOX1 belt was cropped between 35 and 40 kDa. GAPDH belt was cropped between 35 and 40 kDa. On Day 3, the HMOX1 and HIF1α belts were cropped from the same gel, while other belts were cropped from different gels. On Day 7, the NRF2 and GPX4 belts were cropped from the same gel, while other bands were cropped from different gels. Full-length blots were presented in Additional file 2: Fig. S2A–M. (J) Quantification of protein expression levels of WB bands in Figure (I). **P")
 Protein levels of SLC7A11 and GPX4 were detected by Western blot (n = 3). (b) The contents of MDA and GSH were evaluated using commercial kits (n = 3). (c) A tissue iron assay kit was used to determine the iron content (n = 3). (d) Protein levels of p-STAT3 and NLRP3 were detected by Western blot (n = 3).")
 and Fe2+ levels (B) in U2OS and MG-63 cells.")
 CCK8 was used to detect the viability of HK-2 cells cultured in different concentrations of glucose medium for 48 h. (B) DCHF-DA staining revealed the generation of ROS (green) in high glucose-cultured HK-2 cells compared to the control cells, which was partially reduced by Fer-1 treatment for 48 h. (C) Western blot analysis of GPX4, SLC7A11, FTH-1")

. Control (untreated); PBS group; PEG-CeNPs group (3 mg/mL); lCPP-CeNPs group (3 mg/mL); cCPP-CeNPs group (3 mg/mL); pirenoxine sodium eye drops. B The formation of anterior subcapsular cataract in the lenses after 3.6 kJ/m2 illumination of UV exposure and indicated treatments. Immunofluorescence staining (C) and statistics (D) of ferroptosis-related proteins ACSL4, GPX4 and xCT (scale bar, 20 µm). In all histograms, data is presented as the mean ± SD (n = 3). *p < 0.05, **p < 0.01, ***p < 0.001, ****p < 0.0001; ns, no significance")
 was established. b. Ferroptosis indicators, such as Fe2+ accumulation, MDA levels, ROS levels, and the GSH/GSSG ratio, were assessed in the three groups. c. FNR protein expression was assessed in adjacent nontumor tissues and gastric cancer tissues from mice. (d) Tumor sections were spread for volume and weight measurements. (e) Hematoxylin and eosin (H&E) staining revealed the histopathological morphology of gastric cancer tissues with high ferroptosis levels, while Ki-67 staining revealed the cell proliferation capacity. Scale bar: 100 μm. (f) Expression of the 7 selected circRNAs in 46 pairs of gastric cancer and adjacent tissues from clinical samples obtained during surgery. The graph shows the mean ± standard deviation (SD) values; *p")
 Fe2+ content. (B) Damaged mitochondria were indicated by the ratio of the number of damaged mitochondria to the total number of mitochondria. (C) Mitochondrial morphology (magnification, ×20,000). The red arrows represent damaged mitochondria and the green arrows represent normal mitochondria. Lipid reactive oxygen species levels were analyzed using (D) flow cytometry and the results were presented as (E) scatter diagrams and (F) histograms. Percentage represents the proportion of the number of C11-BODIPY staining positive cells compared with the total number of cells. (G) Protein expression levels of GPX4 and SLC7A11 and (H) GPX activity in H/R cells. Data are presented as the mean ± SD (n=3). GPX, glutathione peroxidase; SLC7A11, solute carrier family 7-member 11; H/R, hypoxia/reoxygenation; RGS12, regulator of G-protein signaling 12; sh, short hairpin RNA; NC, negative control; prot, protein.")
 of ferroptosis between the MNT-NC, MNT-OE and MNT-sh of A549 and PC9 cell lines. c Western blot results showed differences in protein levels of GPX4, SLC7A11, ASCL4, and SAT1 of ferroptosis between the MNT-NC, MNT-OE, and MNT-sh of A549 and PC9 cell lines. d Genome-wide data from the ENCODE project and ChIP-seq results show the solid MNT-binding peak in the promoter region close to the TSS of SAT1. e Characteristic sequences predicted by JASPAR for transcriptional binding of MNT. f, g ChIP-qPCR assay depicting the enrichments of MNT binding in A549 and PC9. h Schematic diagram showing the possible binding sites of MNT to the critical region of the SAT1 promoter are mutated. i Dual luciferase activity assays to analyze the fluorescence intensity of MNT-NC and MNT-OE with or without mutations in the SAT1 promoter region. Data were analyzed by Student’s t-test and presented by mean ± SD in triplicate. ns, not significant")
 downregulates the System Xc-/GSH/GPX4 pathway. A Western blot analyses for SLC7A11, GPX4, FTH (ferritin heavy chain), and GAPDH proteins in Hepa1-6 (n = 3) and HepG2 (n = 3) cells 24 h after NFV exposure. B Quantification of cellular GSH levels in Hepa1-6 (n = 3) and HepG2 (n = 3) cells after NFV (40 µM) treatment for 24 h. Data were presented as Mean ± SD. Differences were assessed by unpaired t test. **p")
 SOD enzyme activity in mammary tissue of the LC group and HC dairy goats. (B) CAT enzyme activity in mammary tissue of the LC group and HC dairy goats. (C) GSH level was measured in different groups using GSH Assay Kit. (D and E) Fe2+ (D) and total iron (E) content of mammary tissue in both groups. (F) Measurement of MDA in mammary tissue using an MDA assay kit. (G and H) Representative images and relative intensities of ferroptosis-associated proteins in mammary tissue of dairy goats in LC and HC groups (n = 3). (I–N) MDA level (I), GSH content (J), enzyme activity of CAT (K), enzyme activity of SOD (L), and Fe2+ (M) and total iron (N) content in mammary tissue of mice in groups Abx, Abx+RMTLC, and Abx+RMTHC. (O and P) Serum levels of Fe2+ and total iron in three groups of mice. (Q and R) Representative images and relative intensities of ferroptosis-associated proteins in mammary tissue from three groups of mice (n = 3). Data are presented as the means ± SD, and one-way analysis of variance (ANOVA) was performed for statistical analysis. ∗p < 0.05, ∗∗p < 0.01, ∗∗∗p < 0.001, and ∗∗∗∗p < 0.0001 indicate significant differences.")
 Scheme of BBR regulating Gli1/STAT3-FNR signaling axis in vitro. (B) Principal component analysis in RNA-sequence of HCT116 cells. (C) Correlation plot in RNA-sequence of HCT116 cells. (D) Volcano plot illustrating differentially regulated gene number of HCT116 cells. (E) Kyoto encyclopedia of genes and genomes enrichment analysis in RNA-sequence of HCT116 cells. (F) gene set enrichment analysis of selected pathways including FNR signatures and Hedgehog signaling axis of HCT116 cells. (G) Represented western blot bands of Gli1, STAT3, GPX4, SLC7A11, and FTH1 of HCT116 cells. N = 3. (H) Represented western blot bands of Gli1, STAT3, GPX4, SLC7A11, and FTH1 of CT26 cells. N = 3. Values represented mean ± SD. *p < 0.05 and **p < 0.01.")
 and NeuN (red) in the hippocampal CA1 region. Scale bar =20 µm. B, Representative images of xCT (green) and NeuN (red) in the hippocampal CA1 region. Scale bar =20 µm. GPx4 indicates glutathione peroxidase 4; HIBI, hypoxic-ischemic brain injury; CA1, cornu ammonis 1; SPC, sevoflurane postconditioning.")
 after 48 h of treatment in RKO, HCT116, DLD1, and HT29 cell lines. B Expression of ferroptosis-related target protein was detected by Western blotting after treatment with FTD/TPI (4 μM) for 48 h in RKO, HCT116, DLD1, and HT29 cell lines. C Protein expression of total SLC7A11 was measured after treatment with 2 μM FTD/TPI in combination with 5, 10, 20, or 30 μM Ferrostatin-1 for 48 h in RKO, HCT116, DLD1, and HT29 cell lines. D Protein expression of total SLC7A11 was evaluated after treatment with gradient doses of FTD/TPI (0, 1, 4, 8 μM) and 1 μM Erastin for 48 h in RKO, HCT116, DLD1, and HT29 cell lines. E RNA expression of TP53 was assessed at gradient concentrations of FTD/TPI (0, 1, 4, 8 μM) after 48 h of treatment in RKO, HCT116, DLD1, and HT29 cell lines. F Expression of p53 was detected by Western blotting after treatment with FTD/TPI (4 μM) for 48 h in RKO, HCT116, DLD1, and HT29 cell lines. G Protein expression of p53, SLC7A11, and GPX4 was evaluated at gradient concentrations of FTD/TPI (0, 1, 4, 8 μM) after 48 h of treatment in RKO, HCT116, DLD1, and HT29 cell lines. H Protein expression of p53, SLC7A11, and GPX4 was assessed at different time points (0, 24, 48, 72 h) after treatment with FTD/TPI in RKO, HCT116, DLD1, and HT29 cell lines. I Western blot detected the p53 protein expression in DLD1 cells with TP53 knockout. J Protein expression of SLC7A11 in TP53 knockout DLD1 cells after treatment with FTD/TPI (0, 1, 4 μM) for 48 h. K, L Comparison of ROS and MDA accumulation levels after treatment with 4 μM FTD/TPI for 12 h in TP53 knockout or wild-type DLD1 cells. Data were presented as representative images or mean values ± SD from three or more independent replicates. Statistical analysis was performed using a two-tailed unpaired t-test. *p")
 The differential expression between tumor and normal tissues for SLC7A11 across all TCGA tumors analyzed by TIMER2.0. (B) The expression of SLC7A11 in adjacent tissues and OSCC tissues from the TCGA database. (C) Representative IHC images (left) and quantitative analysis (right) of SLC7A11 expression in adjacent tissues and OSCC tissues from patients. Scale bar: 200 µm for 10 × magnification and 40 µm for 40 × magnification. (D) Western blot analysis of SLC7A11 expression levels in OSCC cell lines compared with NOK. (E) Kaplan-Meier survival analysis of SLC7A11 expression in HNSCC patients by using GEPIA. Values are presented as mean ± SEM. In A, Wilcoxon test; B, Mann-Whitney U test; C, unpaired Student’s t-test; D, one-way ANOVA; E, Log-rank test")
 Each group (Ctrl, LPS [3, 4, and 5 μg/mL]) underwent immunofluorescence image acquisition and statistical analysis for DHE (reactive oxygen species), RhoNox-1 (Fe2+), 5-LOX + GPX4, SLC7A11, and DAPI (nucleus) staining (n = 6 slices per group). Scale bar, 50 μm. ns, no significance, **p")
 mRNA expression of EPAS1 and SLC7A11 in retinoblastoma cell lines (Weri-Rb1, Y79, and HXO-Rb44) and the normal retinal epithelial cell line ARPE-19, determined by qRT-PCR; (B) protein expression of EPAS1 and SLC7A11 in the same cell lines, determined by Western blot analysis. *, P")
 qPCR and western blot analysis of Gfil expression in primary mouse chondrocytes by Gfil siRNA treatment (n = 3). (B, C) AM/PI staining (B) and quantitative analysis (C) of primary mouse chondrocytes induced by 100 μM TBHP for 5 h with or without pretreated Gfi1 siRNA (n = 4). (D) Cell viability of primary mouse chondrocytes as treated in (B) (n = 6). (E) DCFH-DA (ROS), FerroOrange (Fe2+), C11-BODIPY (lipid ROS) staining and quantitative analysis of primary mouse chondrocytes as treated in (B) (n = 4). (F) Immunofluorescence (IF) staining and quantitative analysis of Col II, Mmp13, Cox2 and Gpx4 in primary mouse chondrocytes as treated in (B) (n = 4). (G) Western blot analysis and quantification of indicated proteins in primary mouse chondrocytes as treated in (B) (n = 3). Scale bars, 100 μm. Two-tailed unpaired t-test (A) or one-way ANOVA with Tukey's post-hoc test (B-G). Data are presented as mean ± SD.")
 The bubble plot representing Gene Ontology (GO) analysis of DEGs in Beas-2B cells after PM2.5 exposure. (B) Representative TEM images of the morphological changes in mitochondria, and the red arrows indicate the mitochondria; scale bars: top = 2 μm, bottom = 1 μm. (C) Western blotting analysis and quantification of ACSL4 and xCT proteins. (D–G) Confocal microscopy visualized the alterations in lipid peroxidation and ferrous ions; scale bars = 10 μm. All data presented in this study are representative of at least three independent experiments. Data are presented as the mean ± SEM. PM2.5, particulate matter ≤2.5 μm; DEGs, differentially expressed genes; TEM, transmission electron microscopy.")
 levels in COAD cells. C Correlation analysis between GDF15 and SLC7A11 expression in colon cancer tissues from the GSE39582 data set, assessed using Pearson’s correlation coefficient. D OS of COAD patients stratified by high vs. low SLC7A11 expression in the GSE39582 cohort, analyzed by Kaplan–Meier curves. E Interaction between GDF15 and ERBB2 proteins in HT29 cells, evaluated by co-immunoprecipitation (Co-IP). F, G WB analysis and quantification of ERBB2, p-ERBB2, AKT, p-AKT, and SLC7A11 protein levels under GDF15 modulation. *P")
 and high glucose (HG) groups were visualized using fluorescence microscopy (scale bars = 50 μm); B: Quantification of reactive oxygen species fluorescence intensity (expressed as relative fluorescent area%) in the NG and HG groups; C: Intracellular iron (Fe2+/Fe3+) levels in the NG and HG groups; D: Malondialdehyde levels in the NG and HG groups; E: Glutathione to oxidized glutathione ratio in the NG and HG groups; F-I: Expression levels of ferroptosis-related markers glutathione peroxidase 4 and recombinant solute carrier family 7 member 11 were analyzed by Western blot and quantitative reverse transcription-polymerase chain reaction in the NG and HG groups. NG: Normal group; HG: High glucose; MDA: Malondialdehyde; GSH: Glutathione; GSSG: Oxidized glutathione; GPX4: Glutathione peroxidase 4; SLC7A11: Solute carrier family 7 member 11; GAPDH: Glyceraldehyde 3-phosphate dehydrogenase. aP < 0.05 vs normal group, bP < 0.01 vs normal group, cP < 0.001 vs normal group, and dP < 0.0001 vs normal group.")
. (A–F) Gpx4, Slc7a11, Acsl4, Tfr1, Dmt1 and Sod2 mRNA expression of pups. (G) Representative bands of ferroptosis-associated proteins in the hippocampus of offspring mice. (I-H) Quantification for hippocampal GPX4, SLC7A11, ACSL4 and TFR1 proteins expression of offspring mice. (L) The protein level of ACSL4, TFR1, GPX4, SLC7A11 in the hippocampus of offspring mice by IHC analysis.")
 Relative expression levels of FTH protein and relative expression levels of SLC7A11 protein.")
 Protein expression levels were assessed by Western blotting at 24h.")
製品説明
*The optimal dilutions should be determined by the end user. For optimal experimental results, antibody reuse is not recommended.
*Tips:
WB: For western blot detection of denatured protein samples. IHC: For immunohistochemical detection of paraffin sections (IHC-p) or frozen sections (IHC-f) of tissue samples. IF/ICC: For immunofluorescence detection of cell samples. ELISA(peptide): For ELISA detection of antigenic peptide.
引用形式: Affinity Biosciences Cat# DF12509, RRID:AB_2845314.
折りたたみ/展開
Amino acid transport system xc xCT antibody; Amino acid transport system xc-; Calcium channel blocker resistance protein CCBR1; Calcium channel blocker resistance protein CCBR1 antibody; CCBR1; Cysteine/glutamate transporter antibody; Cystine/glutamate transporter; OTTHUMP00000164578; SLC7A11; Solute carrier family 7 (anionic amino acid transporter light chain, xc- system), member 11; solute carrier family 7; Solute carrier family 7 member 11; Solute carrier family 7, (cationic amino acid transporter, y+ system) member 11; SYSTEM Xc(-) TRANSPORTER-RELATED PROTEIN; xCT; XCT_HUMAN;
免疫原
A synthesized peptide derived from human xCT, corresponding to a region within the internal amino acids.
- Q9UPY5 XCT_HUMAN:
- Protein BLAST With
- NCBI/
- ExPASy/
- Uniprot
MVRKPVVSTISKGGYLQGNVNGRLPSLGNKEPPGQEKVQLKRKVTLLRGVSIIIGTIIGAGIFISPKGVLQNTGSVGMSLTIWTVCGVLSLFGALSYAELGTTIKKSGGHYTYILEVFGPLPAFVRVWVELLIIRPAATAVISLAFGRYILEPFFIQCEIPELAIKLITAVGITVVMVLNSMSVSWSARIQIFLTFCKLTAILIIIVPGVMQLIKGQTQNFKDAFSGRDSSITRLPLAFYYGMYAYAGWFYLNFVTEEVENPEKTIPLAICISMAIVTIGYVLTNVAYFTTINAEELLLSNAVAVTFSERLLGNFSLAVPIFVALSCFGSMNGGVFAVSRLFYVASREGHLPEILSMIHVRKHTPLPAVIVLHPLTMIMLFSGDLDSLLNFLSFARWLFIGLAVAGLIYLRYKCPDMHRPFKVPLFIPALFSFTCLFMVALSLYSDPFSTGIGFVITLTGVPAYYLFIIWDKKPRWFRIMSEKITRTLQIILEVVPEEDKL
種類予測
Score>80(red) has high confidence and is suggested to be used for WB detection. *The prediction model is mainly based on the alignment of immunogen sequences, the results are for reference only, not as the basis of quality assurance.
High(score>80) Medium(80>score>50) Low(score<50) No confidence
研究背景
Sodium-independent, high-affinity exchange of anionic amino acids with high specificity for anionic form of cystine and glutamate.
Membrane>Multi-pass membrane protein.
Belongs to the amino acid-polyamine-organocation (APC) superfamily. L-type amino acid transporter (LAT) (TC 2.A.3.8) family.
研究領域
· Cellular Processes > Cell growth and death > Ferroptosis. (View pathway)
参考文献

Application: WB Species: Rat Sample:

Application: WB Species: Mouse Sample:

Application: WB Species: Mouse Sample:

Application: IF/ICC Species: Mouse Sample:

Application: IHC Species: Mouse Sample:
Restrictive clause
Affinity Biosciences tests all products strictly. Citations are provided as a resource for additional applications that have not been validated by Affinity Biosciences. Please choose the appropriate format for each application and consult Materials and Methods sections for additional details about the use of any product in these publications.
For Research Use Only.
Not for use in diagnostic or therapeutic procedures. Not for resale. Not for distribution without written consent. Affinity Biosciences will not be held responsible for patent infringement or other violations that may occur with the use of our products. Affinity Biosciences, Affinity Biosciences Logo and all other trademarks are the property of Affinity Biosciences LTD.